
India’s Oil Shock Quarter: How the Energy System Withstood a Historic Price Surge
Maritime Gateway Research Bureau
India’s April-June 2026 crude oil and petroleum products trade tells two stories at once. The headline data shows falling volumes and a shrinking trade base. The underlying data shows an energy system that absorbed history’s costliest oil shock without breaking. Reading the two together reveals more about India’s energy security than either does alone.
The Volume-Value Divergence Is the Real Story
Crude oil imports fell in volume terms to 58.12 MMT for the quarter, yet the cost of securing those barrels reached levels never before recorded, with landed crude averaging 113 dollars a barrel during the Strait of Hormuz disruption. This divergence between falling volumes and record costs is the single most important number in this report. It means Indian refiners were not simply paying more for the same oil. They were actively rationing intake while prices spiked, a defensive posture rather than business as usual.
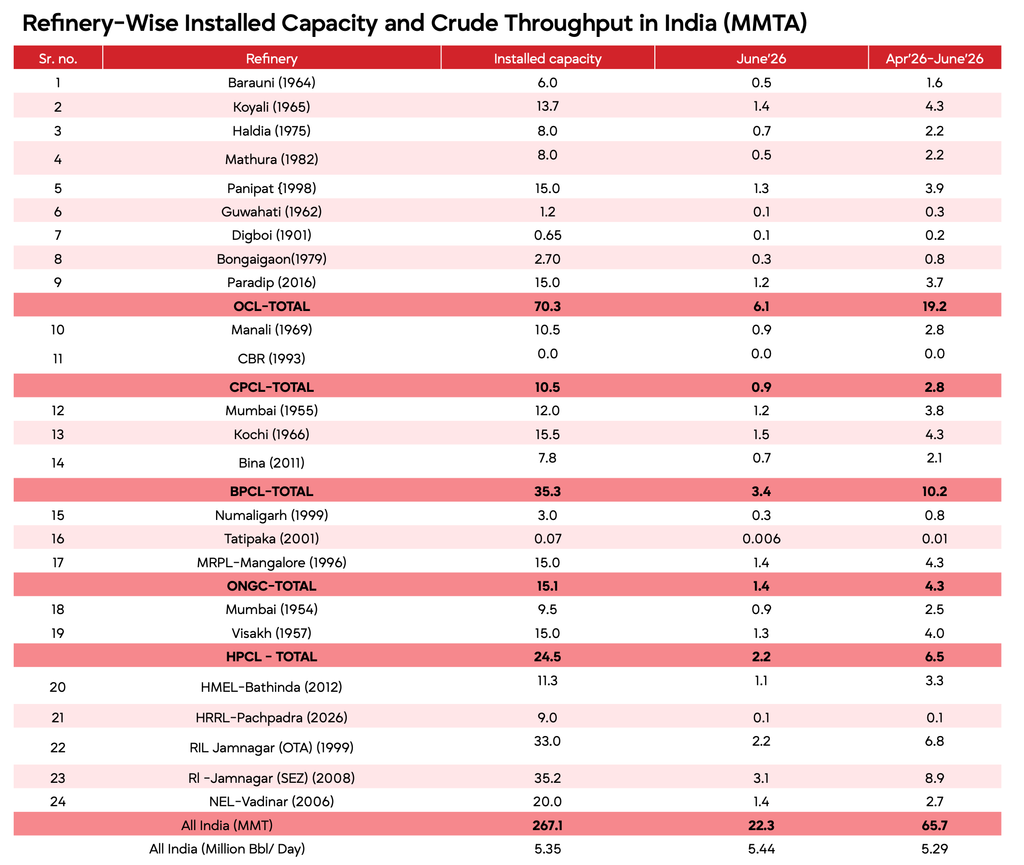
That rationing shows up again in refining. Total crude processed in June rose only marginally against the previous year, even though installed capacity across India’s refineries stands at 267.1 MMT against a quarterly throughput of just 65.7 MMT. Refiners had substantial spare capacity available and chose not to use it aggressively. That is a system managing risk, not one straining at its limits.
Russia’s Discount Became India’s Shock Absorber
The clearest structural shift in the quarter is the scale of Russian crude in India’s import basket. Russia supplied 21.95 MMT, more than the next four supplying countries combined, and Russian crude purchases climbed 34 percent month-on-month in June to a record 5.14 billion dollars, making India the world’s second-largest buyer of Russian fossil fuels that month.
This is not incidental. When Hormuz-linked volatility hit Gulf spot prices hardest, the discounted Russian barrel became the mechanism that kept India’s refining system supplied without forcing an even sharper cut in throughput. The UAE, Saudi Arabia and Oman together supplied barely half of what Russia alone delivered. For an economy that remains 88.5 percent dependent on imported crude, that concentration in a single discounted source is both the reason the shock was manageable and a new vulnerability worth watching once Russian barrel discounts eventually narrow.
Exports Fell Faster Than Imports, and That Matters
Petroleum product exports dropped 24.7 percent for the quarter, a steeper decline than the fall in crude imports. Read alongside a 41.1 percent quarterly contraction in product imports, the pattern points to refiners prioritising the domestic market over export margins during the price spike.
Reliance Industries, India’s largest single product exporter at 9.34 MMT, and the broader export complex at Sikka effectively pulled back from the international arbitrage trade to keep more refined output at home.
This matters because it shows Indian refining capacity functioning as intended during a supply shock: as a buffer for domestic consumption first, and an export platform second. Diesel and petrol consumption both grew even as overall product demand slipped 5 percent, indicating that core transport fuel demand was insulated from the volatility while discretionary and industrial products such as LPG, naphtha and bitumen absorbed the pullback.
The product mix itself shifted in June, with refined output of 22.5 MMT down 4 percent year-on-year and high-speed diesel accounting for 43 percent of production, followed by motor spirit/petrol at 18.7 percent, naphtha at 6.2 percent, LPG at 6.6 percent, aviation turbine fuel at 5.1 percent, and pet coke at 4.5 percent.
On the consumption side, the quarter’s 5 percent overall decline broke down unevenly: diesel consumption rose 2.8 percent, petrol 5.8 percent, and ATF 0.3 percent, while LPG, naphtha, bitumen and other products dragged the total down. June alone saw consumption fall 3.1 percent year-on-year, with LPG down 14.3 percent, bitumen down 18.4 percent, and naphtha down a steep 42.8 percent, the clearest sign yet of which products absorbed the demand pullback.
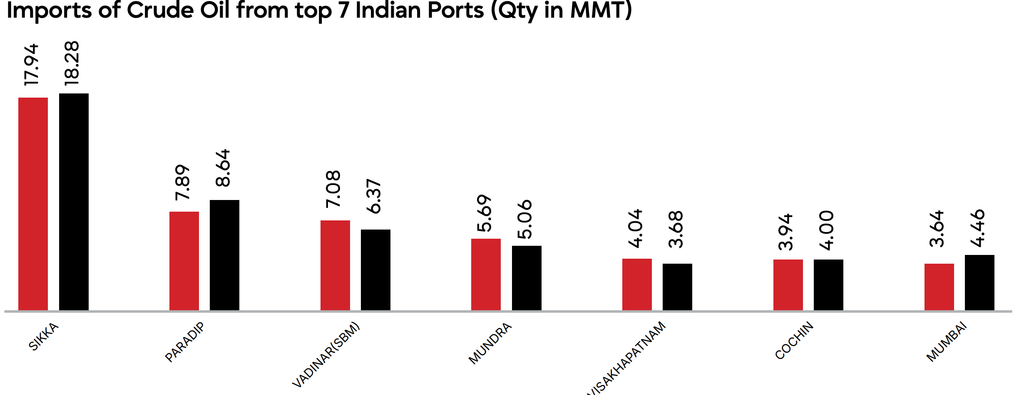
Sikka’s dominance extended to exports as well, handling 8.76 MMT for the quarter, more than eight times the volume of the next-largest port, while declines in product shipments were concentrated in motor spirit, high-speed diesel and naphtha. On the import side, Abu Dhabi National Oil Company (4.98 MMT) and Venezuela’s PDVSA (2.73 MMT) were among the leading counterparties, while Indian Oil Corporation (19.64 MMT) and Reliance Industries (17.51 MMT) led product imports.
The Fiscal Arithmetic Behind Price Stability
The government’s intervention was direct and costly. A 10 rupee per litre excise cut combined with a 76-day retail price freeze kept CPI inflation below 4 percent, but at a price: 2,400 crore rupees a day in losses for state oil marketing companies and roughly 12 billion dollars in foregone exchequer revenue.
The rupee still slid nearly 5 percent to 93 against the dollar, requiring the RBI to deploy 46 billion dollars in reserves. What stands out is what did not move. GDP growth held at 7.7 percent and manufacturing growth at 10.7 percent through the quarter. A shock of this magnitude, landing on an economy this import-dependent, would historically have shown up in growth numbers within a quarter. That it did not suggests the fiscal buffers, industrial gas rationing and the 25 percent mandated increase in domestic LPG output worked as intended, transferring the cost to the exchequer and reserves rather than to households or output.
The rationing measures behind that LPG push were more specific than the headline figure suggests. Authorities capped fertiliser plant gas allocations at 70 percent of normal supply and directed the extra domestic LPG output toward protecting the country’s 332 million residential LPG connections, effectively shielding households from the industrial-side rationing entirely.
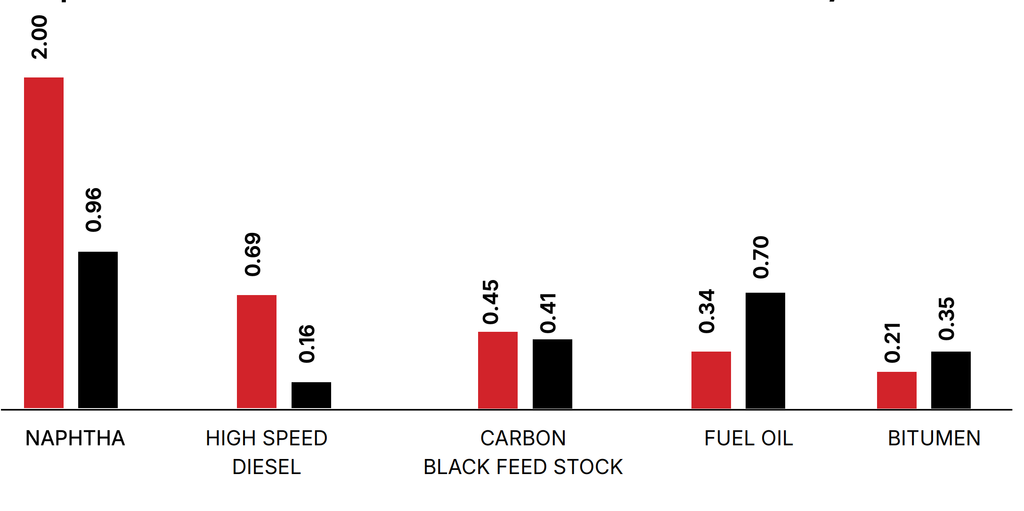
Import Traffic of POL Products from Indian Ports (Qty in MMT)
| Product | Current | Previous |
|---|---|---|
| Naphtha | 2.00 | 0.96 |
| High Speed Diesel | 0.69 | 0.16 |
| Carbon Black Feed Stock | 0.45 | 0.41 |
| Fuel Oil | 0.34 | 0.70 |
| Bitumen | 0.21 | 0.35 |
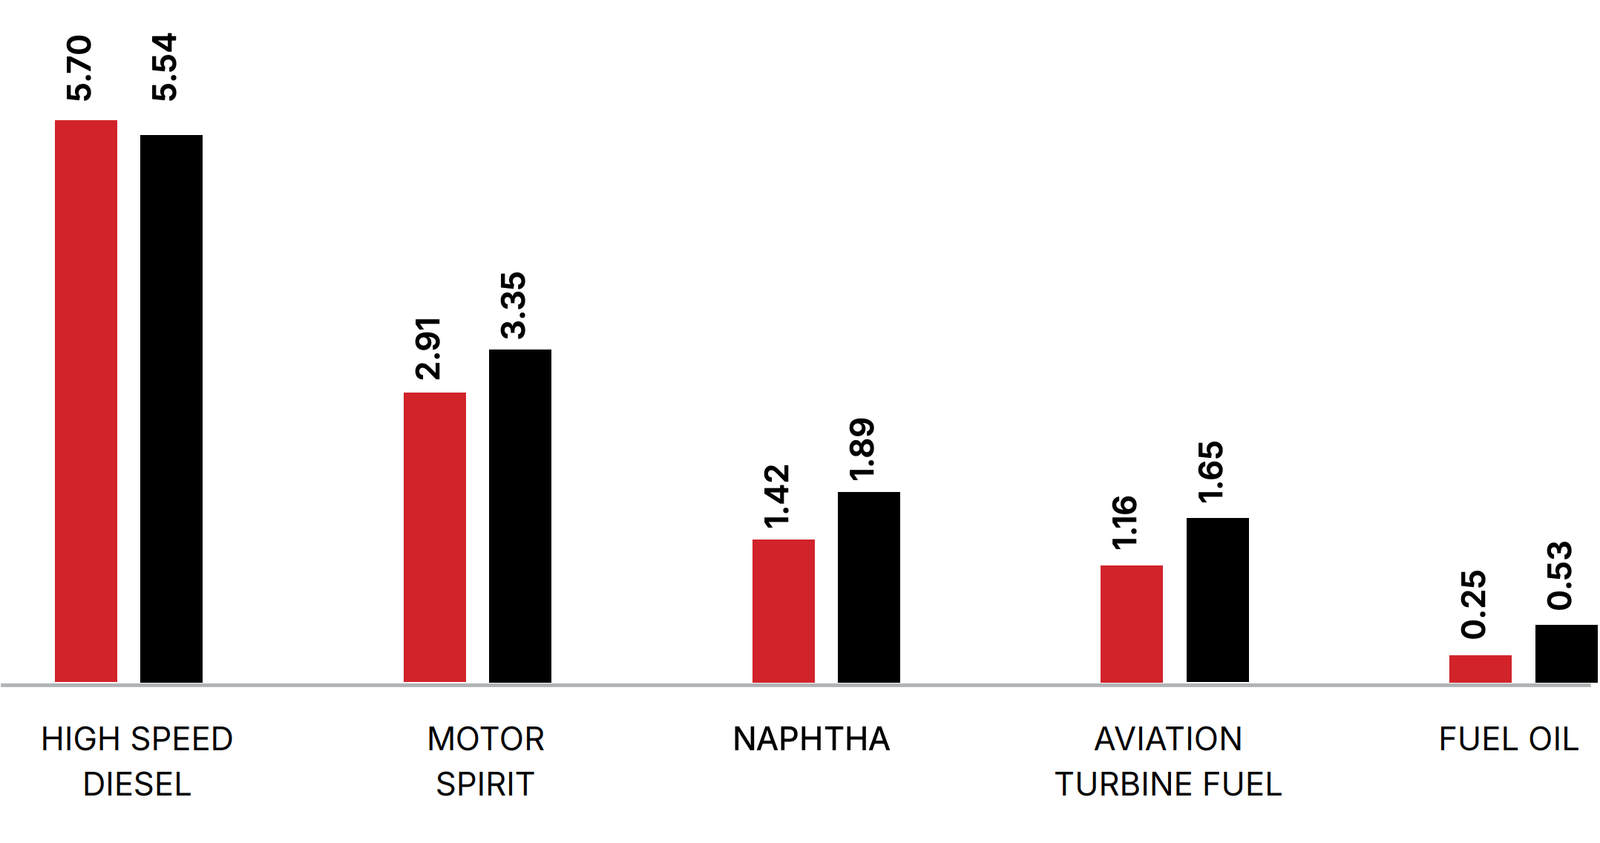
Export Traffic of POL Products from Indian Ports (Qty in MMT)
| Product | Current | Previous |
|---|---|---|
| High Speed Diesel | 5.70 | 5.54 |
| Motor Spirit | 2.91 | 3.35 |
| Naphtha | 1.42 | 1.89 |
| Aviation Turbine Fuel | 1.16 | 1.65 |
| Fuel Oil | 0.25 | 0.53 |
The Structural Hedge Is Already Paying Off
That non-fossil base breaks down as 162.15 GW of solar, 57.44 GW of wind, 57.24 GW of hydro, and 8.78 GW of nuclear, solar alone now accounting for more than half of India’s non-fossil generating capacity.
The ethanol programme’s benefits have also extended beyond forex savings: the same displacement of 310 lakh tonnes of crude is estimated to have cut around 930 lakh tonnes of carbon emissions since 2014-15, giving the structural hedge an emissions dimension alongside its balance-of-payments one.
The Hormuz quarter was a stress test. The data shows a system that passed it, but one that leaned heavily on two levers, discounted Russian crude and exchequer-funded price freezes, that both carry limits. The next disruption may not find both levers available at the same scale.
Crude Oil
Imports of Crude Oil from Top 7 Indian Ports (Qty in MMT)
| Port | Current | Previous |
|---|---|---|
| Sikka | 17.94 | 18.28 |
| Paradip | 7.89 | 8.64 |
| Vadinar (SBM) | 7.08 | 6.37 |
| Mundra | 5.69 | 5.06 |
| Visakhapatnam | 4.04 | 3.68 |
| Cochin | 3.94 | 4.00 |
| Mumbai | 3.64 | 4.46 |
Refinery-Wise Installed Capacity and Crude Throughput in India (MMTA)
| Sr. No. | Refinery | Installed Capacity | June’26 | Apr’26–June’26 |
|---|---|---|---|---|
| 1 | Barauni (1964) | 6.0 | 0.5 | 1.6 |
| 2 | Koyali (1965) | 13.7 | 1.4 | 4.3 |
| 3 | Haldia (1975) | 8.0 | 0.7 | 2.2 |
| 4 | Mathura (1982) | 8.0 | 0.5 | 2.2 |
| 5 | Panipat (1998) | 15.0 | 1.3 | 3.9 |
| 6 | Guwahati (1962) | 1.2 | 0.1 | 0.3 |
| 7 | Digboi (1901) | 0.65 | 0.1 | 0.2 |
| 8 | Bongaigaon (1979) | 2.70 | 0.3 | 0.8 |
| 9 | Paradip (2016) | 15.0 | 1.2 | 3.7 |
| OCL-TOTAL | 70.3 | 6.1 | 19.2 | |
| 10 | Manali (1969) | 10.5 | 0.9 | 2.8 |
| 11 | CBR (1993) | 0.0 | 0.0 | 0.0 |
| CPCL-TOTAL | 10.5 | 0.9 | 2.8 | |
| 12 | Mumbai (1955) | 12.0 | 1.2 | 3.8 |
| 13 | Kochi (1966) | 15.5 | 1.5 | 4.3 |
| 14 | Bina (2011) | 7.8 | 0.7 | 2.1 |
| BPCL-TOTAL | 35.3 | 3.4 | 10.2 | |
| 15 | Numaligarh (1999) | 3.0 | 0.3 | 0.8 |
| 16 | Tatipaka (2001) | 0.07 | 0.006 | 0.01 |
| 17 | MRPL–Mangalore (1996) | 15.0 | 1.4 | 4.3 |
| ONGC-TOTAL | 15.1 | 1.4 | 4.3 | |
| 18 | Mumbai (1954) | 9.5 | 0.9 | 2.5 |
| 19 | Visakh (1957) | 15.0 | 1.3 | 4.0 |
| HPCL-TOTAL | 24.5 | 2.2 | 6.5 | |
| 20 | HMEL–Bathinda (2012) | 11.3 | 1.1 | 3.3 |
| 21 | HRRL–Pachpadra (2026) | 9.0 | 0.1 | 0.1 |
| 22 | RIL Jamnagar (OTA) (1999) | 33.0 | 2.2 | 6.8 |
| 23 | RI–Jamnagar (SEZ) (2008) | 35.2 | 3.1 | 8.9 |
| 24 | NEL–Vadinar (2006) | 20.0 | 1.4 | 2.7 |
| All India (MMT) | 267.1 | 22.3 | 65.7 | |
| All India (Million Bbl/ Day) | 5.35 | 5.44 | 5.29 |
Key Takeaways
The April–June 2026 period demonstrated that India’s energy system can withstand severe external shocks. Strategic sourcing of discounted Russian crude, strong refining infrastructure, targeted fiscal intervention, and growing renewable energy capacity all contributed to maintaining economic stability during a period of extraordinary volatility.
However, the experience also exposed potential vulnerabilities. Heavy dependence on imported oil and reliance on discounted Russian supplies may become challenges if future disruptions occur under different market conditions. As India continues its energy transition, diversification of supply sources and accelerated investment in alternative energy will remain critical to strengthening long-term energy security.