
India’s fertilizer sector is navigating one of its most turbulent periods in recent memory. The West Asia conflict has exposed deep structural vulnerabilities in a supply chain that feeds over a billion people. Despite these challenges, the government’s response has been swift, strategic, and surprisingly robust.
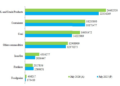
Total fertilizer imports reached 38.84 million metric tonnes (MMT) in FY 2025-26, a significant increase from 30.27 MMT in the previous year. India accelerated imports to build strategic buffers ahead of the crucial Kharif season. Rock Phosphate led imports at 10.77 MMT, followed by Urea (6.38 MMT) and Di-Ammonium Phosphate (DAP) (4.85 MMT).
Why India’s Fertilizer Supply Chain Is Under Pressure
The primary risk lies in the Strait of Hormuz, through which a large share of India’s fertilizer raw materials, including natural gas, ammonia, and sulfur, transit.
A five-week conflict involving Iran triggered a severe logistics disruption:
- Approximately 2,000 vessels were delayed
- Indian shipments carrying 150,000 tonnes of urea were affected
- China tightened export restrictions on both Urea and DAP
- India was forced to rapidly diversify sourcing strategies
Fertilizer Imports at Major Indian Ports
Top Fertilizer Import Ports (FY 2025-26)
| Rank | Port | Import Volume (MMT) |
|---|---|---|
| 1 | Paradip | 6.75 |
| 2 | Kandla | 5.10 |
| 3 | Mundra | 4.43 |
| 4 | Visakhapatnam | 4.30 |
| 5 | Kakinada | 3.37 |
Key Insights
Paradip remains India’s largest fertilizer gateway, handling 6.75 MMT, primarily Rock Phosphate and Sulfur imports.
Kandla, Mundra, and Visakhapatnam have all experienced strong growth, reflecting India’s efforts to diversify port-level risk and improve supply chain resilience.
Supply Chain Resilience: The NPK Divide
India’s fertilizer outlook varies significantly across the three primary nutrient categories: Nitrogen (N), Phosphorus (P), and Potassium (K).
Nitrogen (Urea): Stable and Improving
Domestic Production: 17 MMT
Import Dependency: 20-30%
Key developments:
- Domestic production now meets nearly 80% of national demand
- Natural gas allocation to urea plants increased from 70% to 90%
- LNG partnerships are helping restore production capacity
Phosphatic Fertilizers (DAP): Caution Required
Domestic Production: Approximately 5.1 MMT
Import Dependency: 30-40%
India remains dependent on global markets to bridge the supply gap, with Morocco and Saudi Arabia continuing to be major suppliers.
Potassic Fertilizers (MOP): Most Vulnerable
Domestic Production: Nil
Import Dependency: 100%
Challenges include:
- Complete reliance on imports
- Supply exposure to geopolitical tensions in Jordan and Israel
- Increased focus on long-term agreements with Canada and Russia
Global Supply Disruptions and Price Surge
Major Challenges
- Global Urea prices have climbed to approximately $800 per tonne FOB
- Landed costs could approach $900 per tonne
- Vessel delays disrupted global shipping networks
- China has restricted fertilizer exports
The Kharif Challenge
India faces a projected 21-million-tonne fertilizer shortfall for the 2026 Kharif season. However, government efforts to reroute shipments, diversify sourcing, and actively monitor supplies are expected to prevent major shortages and protect farmers from price increases.
Domestic Stock Position
Fertilizer Availability (April 1, 2026)
| Fertilizer Type | Stock Available |
|---|---|
| Urea | 6.2 MMT |
| DAP | 2.3 MMT |
| NPK / Complex Fertilizers | 5.7 MMT |
India entered FY 2026 with nearly 18 million tonnes of available stock, providing a strong buffer. However, Kharif demand is expected to reach 39 million tonnes, necessitating substantial additional imports.
Government Strategy to Secure Supply
Key Measures
Diversifying Import Sources
India is actively engaging with:
- Russia
- Belarus
- Morocco
- Indonesia
- Vietnam
to reduce dependence on Middle Eastern and Chinese suppliers.
Boosting Domestic Production
The government has increased natural gas allocations to domestic urea plants, helping maximize local manufacturing capacity.
Building Strategic Reserves
Indian Potash Ltd. (IPL) has issued a tender for 2.5 million tonnes of Urea to strengthen supply security ahead of the planting season.
Monitoring and Market Stabilization
A dedicated monitoring war room and anti-hoarding measures have been established to prevent supply disruptions from reaching farmers.
Fiscal Impact: The Rising Subsidy Burden
The Union Cabinet increased the Kharif Nutrient-Based Subsidy (NBS) allocation to ₹41,534 crore, representing an additional ₹4,300 crore compared to the previous year.
The government continues to maintain the retail price of DAP at ₹1,350 per 50 kg bag, absorbing higher global costs through subsidies.
If international Urea prices remain close to $900 per tonne, further subsidy support may be required, placing additional pressure on public finances.
Top Fertilizer Import Sources for India (FY 2025-26)
| Country | Share of Imports | Key Products |
|---|---|---|
| Russia | 17% | MOP, Urea, NPK |
| Jordan | 14% | Rock Phosphate |
| Morocco | 14% | Rock Phosphate, DAP |
| Saudi Arabia | 14% | DAP, Urea |
| China | 14% | DAP, Ammonium Sulphate |
| Oman | 8% | Urea |
Outlook
India’s fertilizer ecosystem is facing one of its biggest stress tests in recent years. Yet the combination of strategic imports, diversified sourcing, higher domestic production, and proactive government intervention has helped maintain stability.
The coming months will determine whether these measures can fully offset geopolitical disruptions and global price volatility. For now, India’s fertilizer supply chain remains under pressure, but it is proving more resilient than many expected.